Important Customer Service Metrics for 2023
Sudeepa Bose
Customer service is the backbone and one of the most critical elements of every business. It has become a significant differentiator to get an edge over the competition.
A brand’s reputation is built over time, and customer service can make or break a brand and its reputation. Customer expectations are always on the rise, and brands can lose the excellent reputation of their brand overnight with a lousy customer service strategy.
In fact, 91% of dissatisfied customers leave brands without complaining, which means companies lose the opportunity to mend the situation.
According to Jeff Bezos, customer obsession is “the first and by far the most important” key to a successful business. Amazon isn’t the only brand in this belief: Netflix is one of many Fortune 500 businesses that believe happy customers are the foundational element of a successful business.
Studies also suggest 70% of consumers choose companies that offer excellent customer service.
So, if you want to win, the ultimate goal of your business should be to develop a solid customer service strategy to keep your customers happy. But, defining and measuring data for customer service is a challenging task.
When developing or optimizing your customer service strategy, it’s crucial to define your key performance indicators (KPIs) and customer service metrics. Customer service metrics are your guiding light to achieve maximum success.
If you are wondering what critical customer service metrics and KPIs are worth obsessing over, this blog is for you.
Keep reading, as this article highlights everything you need to know about customer service metrics and KPIs.
So, without any further ado, let’s get started.

What are Customer Service Metrics?
Customer success metrics and KPIs are the measurable indicators that reflect your support process and the state of your customer’s happiness level. It paints a clearer picture of success for the long-term viability of a business.
The brands use these metrics to track and see if their strategy is working effectively or how well your customer is doing with product adoption, retention, and recommending the brand’s product to other users.
Customer service metrics and KPIs are performance parameters that tell you exactly how the customer service function contributes to your business’ overall growth.
These metrics establish the process that will maximize the lifetime value of your customer relationships. When correctly tracked, customer success metrics can give insights into critical areas like customer churn, adoption rates, product satisfaction, and more.
Using the right customer support metrics will help you measure your performance and reach the best outcomes in terms of quality and engagement.
But why is it crucial for every business to track these metrics in 2023?
Let’s find out.
Why Are Customer Service Metrics Important?
Customer support metrics and KPIs are the data that help you and your team understand where you are, where you want to go, and how you’ll get there and align with your company’s goals.
They are important because these metrics offer a behind-the-scenes picture of how brands interact with customers.
The performance metrics furnish unbiased numbers for brands to measure customer service success. Without measurement, it is hard to understand the areas that need improvement and the areas that are doing well.
When you have customer service metrics and key performance indicators (KPIs), you have vital data analytics to help you make better decisions to succeed in the below listed key three areas.
- Measure Team Performance
Customer service metrics and KPIs gauge how efficiently your team handles service requests. It gives you the proper knowledge about your team’s gray areas, further creates enhancement programs, and plans training sessions to accomplish customer service benchmarks.
- Boost Customer Satisfaction
Customer satisfaction is a critical customer support metric that defines how happy your consumers are with your product/services. The higher the satisfaction score, means longer the customer lifetime value (CLTV).
- Increase Customer Retention
Measuring customer service gives you insights into customer satisfaction scores. When brands try aligning their products/services to the customers, it keeps them happy, so they not only choose to retain the business but also become brand advocates.
Your customer service KPIs should focus on strategic and operational improvement and create an analytical basis for proper decision-making.
The right combination of metrics will make it both measurable and motivating, and your brand can answer the following vital questions:
- Is your customer support team responsive and fast enough?
- How do your customers feel about your products and services?
- Can your customers easily use your website and services?
- Is your communication effective and sufficient to gain trust and loyalty?
- How effective are your marketing campaigns and sales processes?
You can answer these questions if you abide by the following customer service metrics. Now, let’s talk about the most crucial customer service metrics we suggest you implement.

There are many different types of customer service software out there. Finding the right one can be hard, but we’re here to help. Download our free ebook now!
10 Most Essential Customer Service Metrics to Track in 2023
It is more important for customer service teams to understand how the brand performs against customers’ expectations. Tracking customer service metrics in 2023 is like monitoring your business’ vital signs. There are core KPIs that every business needs to be watching closely.
Some are based on tangible metrics like resolution time, while others look at your customers’ feelings towards your company and how they perceive an interaction. But with numerous customer service metrics out there, it’s challenging to comprehend which ones to prioritize to ensure the best customer experience.
Below are the ten key customer service metrics that measure performance and drive revenue.
1. Customer Satisfaction Score (CSAT)
CSAT, short for Customer Satisfaction, is one of the most heavily benchmarked customer experience metrics. It is a major performance indicator that tracks customers’ satisfaction with your company’s products/services. Measuring customer sentiment through CSAT is the first step toward driving business-critical decisions through data.
You can ask your customers to rate their satisfaction directly via different communication channels and collect real-time customer feedback. The average of all customer responses will be your CSAT score.
You can ask questions such as:
- How satisfied are you with our product/services? (Answers may be Extremely Satisfied, Satisfied, Somewhat Satisfied, Neutral, or Unsatisfied)
- Are you happy with our product or service? (Yes/No)
- On a scale of 1-10, how would you rate your satisfaction with our product/services?
Your CSAT scale can include regular numbers, stars, smiley faces, etc. The higher the CSAT score, the better your customer satisfaction. Implement ways to collect qualitative and quantitative feedback that helps you understand the areas that are working well and the gaps that need improvement.
How to measure it?
There is no unified measurement of satisfaction score, but that said, one could execute the below formula to determine the rate of satisfied customers:


Explore CSAT’s role in e-commerce success, its measurement techniques, and strategies to optimize customer satisfaction for sustained growth. Read more now!
2. First Response Time (FRT)
First response time (FRT) refers to the time that passed between customer issue submission via chat or social media and the customer service agent’s first response. The speed at which you acknowledge the customer’s query mirrors your commitment to customer delight and the efficiency of your customer support team. In short, evaluating FRT stresses the importance of customer response time.
Getting a response helps brands to boost the customer experience. Over 59% of customers are more likely to purchase when brands answer their queries in less than a minute. In contrast, a delay in the response time might result in customers leaving your website and your business.
FRT is best measured during business hours. Higher evaluation scores indicate that your customer service team is enthusiastic about responding to customer queries.
Why are FRT important customer service metrics?
- It indicates the promptness of your team’s issue addressing.
- It acknowledges the customers’ problems are being looked into on priority.
- With this KPI in place, you can learn if your team is sufficient or needs additional resources.
How to measure it?
You can use the below formula to find out the customer service matrix. This KPI will help you to identify the quality of service your customer experience.

You can calculate the average FRT based on the sum of all first response times divided by the number of solved tickets. FRTs are usually cited in minutes, hours, and days.
A good FRT varies based on what channel your customer picks to reach you and even the time to contact you. Ideally, an exceptional first response time is 45 seconds or below for live chat and 4 hours or below for email or social media. Around 53% of customers feel three minutes is the acceptable wait time for phone support.
Based on a Benchmark data review, below is a guide to the expected first response time by channel.
| Channel | Good | Better | Best |
| 12 hours or less | 4 hours or less | 1 hour or less | |
| Social media | 2 hours or less | 1 hour or less | 15 minutes or less |
| Live chat | 1 hour or less | 5 minutes or less | 1 minute or less |
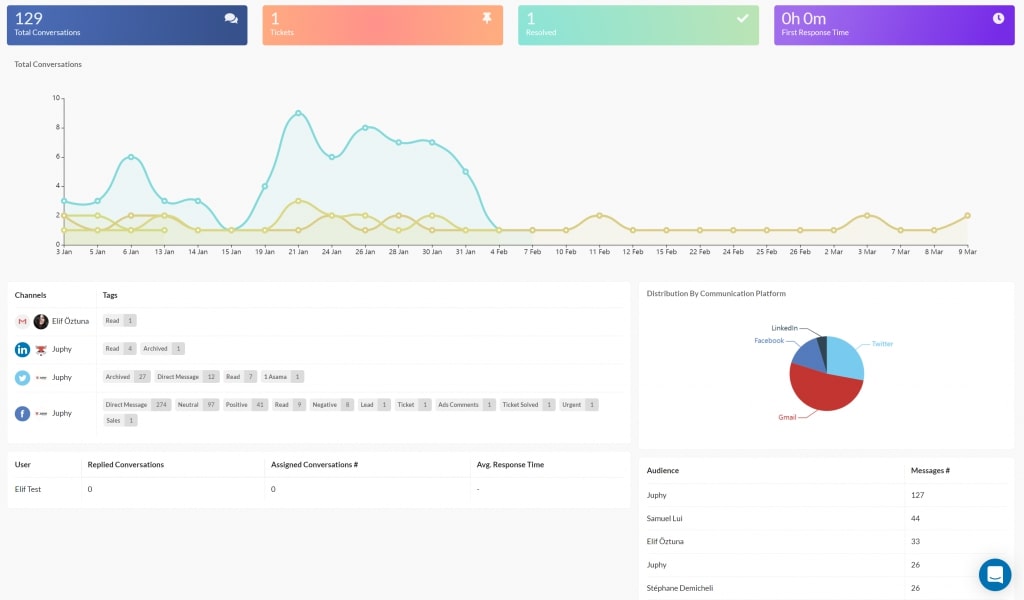
Pro Tip: Create helpful canned responses with Juphy and get ready answers to the most frequently asked customer questions. Just one click and you’re all set!
3. Average Resolution Time (ART)
Average Resolution Time monitors the average time your customer support agents take to close the opened tickets with an effective resolution in a given time frame. This metric is also termed Average Ticket Resolution Time, Average Time to Resolution, and Mean Time To Resolution (MTTR).
Measuring on a per-agent basis better indicates your overall customer satisfaction. It lets you see which ticket takes longer to solve and how fast you act upon a particular ticket. A help-desk software or ticketing system software can benefit your customer service team to work more efficiently.
Average Response Time(ART) is directly correlated with customer satisfaction. Close to 60% of customers feel that long wait times are the most frustrating part of customer service, so ART is important to factor this metric into your service practices.
The Average Resolution Time varies depending on the complexity of the customers’ issue and the ratio of available customer support agents to queued tickets in the measured time frame.
How to measure it?
Here’s a simple formula that you could use to find out the average response time:
Pro Tip: Use Juphy’s ticketing system to follow the tickets, complaints, comments, and messages in the notifications from social platforms in a single tab through Juphy and assign them for prompt action.
4. Net Promoter Score (NPS)
The NPS customer service metric is the gold standard of customer experience metric widely used to gauge the loyalty of the company-customer relationship. It measures the client’s experience and presumes the growth of your business.
The NPS metric is a good loyalty indicator that is also associated with increased business growth. With the help of the NPS score, you can determine how likely the customers are to recommend your brand to others.
NPS replies aim at the intention and not the emotion, like CSAT. It determines the customer’s perception based on one straightforward question:
“How likely is it that you would refer to the brand?”
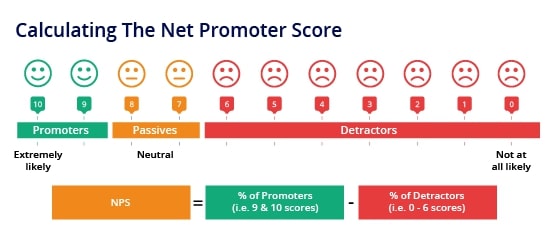
Respondents rate the brand between 0 (not at all) and 10 (extremely likely). Depending on the response given, customers fall into one of these three categories to establish an NPS score:
- Promoters (9-10) – The loyal customer base who will continue to buy from you and become brand advocates for you.
- Passives (7-8) – The passive ones are satisfied customers but vulnerable to competitive offers and deals.
- Detractors (0-6) – The unsatisfied or unhappy customers negatively impact your brand through damaging word-of-mouth marketing.
How to measure it?
The NPS is calculated by taking the percentage of the promoters (9-10) out of the total respondents and then subtracting it from the detractors (0-6).
5. Customer Effort Score (CES)
Customer Effort Score (CES) is a single-item customer experience metric that measures the effort your customers put in to interact with your brand and how easy it is for them to do business with you.
The main aim is to understand the sentiments of consumers who do business with you. Customers are more loyal to a product or service when it is easier to use. You’ll create a better customer service experience by focusing on easing customer effort.
CES surveys typically ask, “how easy was it to interact with [Brand] on a scale of ‘very easy’ to ‘very difficult’?”
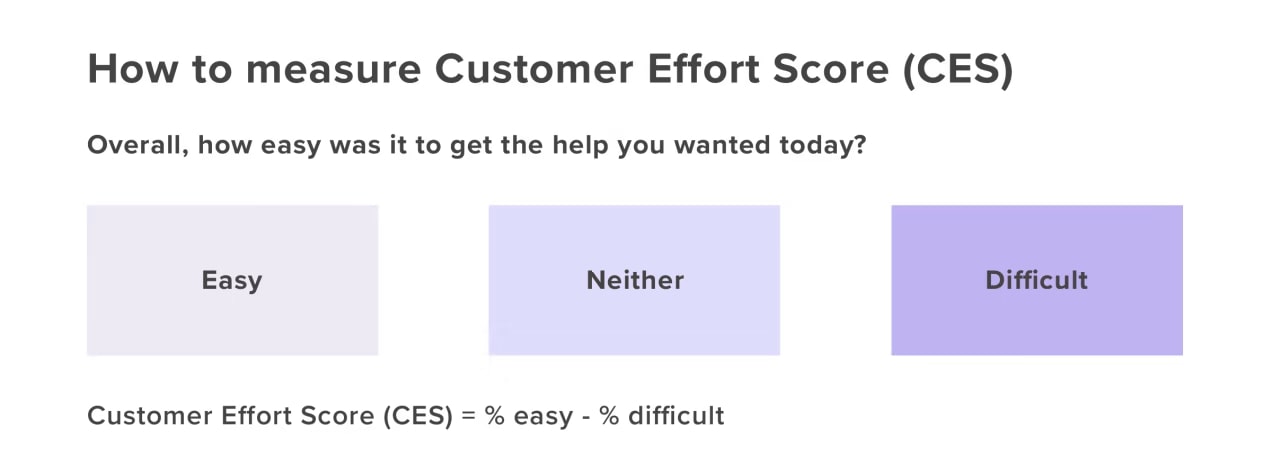
The customer rates on a scale of 1 to 5 based on how much effort the customer takes to interact with your brand to complete a transaction, resolve a support issue, or otherwise, online or in person.
How to measure it?
Here is the easiest way to get an average score:

6. Average Handle Time (AHT)
AHT, or Average Handling Time, measures how long it takes for an agent to resolve an issue. The shorter the handling time, the more efficient your customer support team is.
While it is not the primary focus, as agents may rush through customer tickets instead of focusing on delivering excellent customer service, AHT shows how well-equipped the agent is to address customer queries. So, consistent measurement, monitoring, and taking action on AHT are essential KPIs for any support team.
You can minimize AHT by reducing customer wait time and optimizing each back-and-forth interaction.
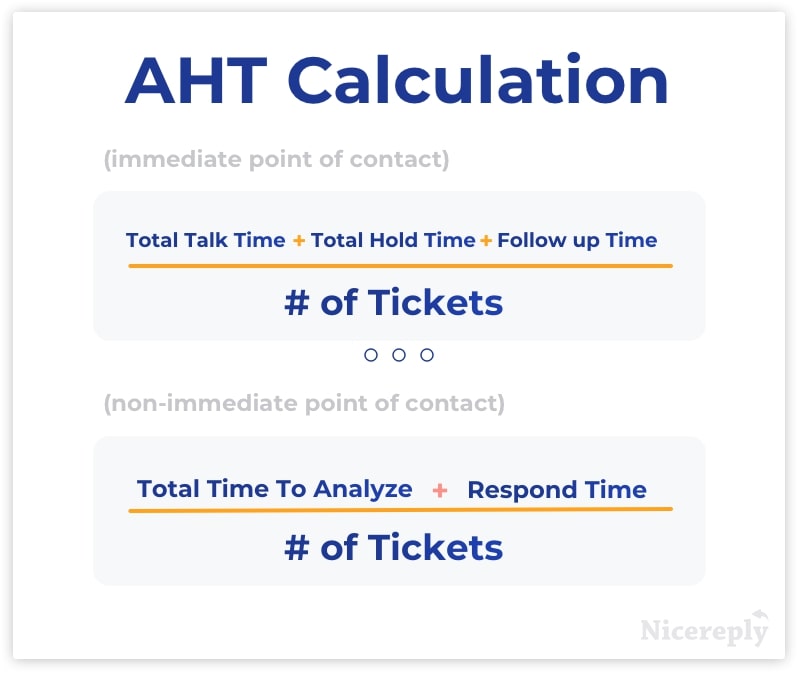
How to measure it?
To calculate AHT, add up the tidal time it takes to close a ticket from when your customer initially reached out, hold/wait time, back-and-forth interaction and subsequent tasks, and post-interaction system updates.
7. First Contact Resolution Rate (FCR)
The first contact resolution rate (FCR) is a critical customer service metric or KPI that measures the number of customer queries resolved on the first interaction.
Simply put, it measures how many issues were solved in the first contact. It also includes the ability to do so without escalations or follow-ups by the agent.
FCR is an essential factor in improving customer service efficiency and customer satisfaction. A high FCR rate correlates with CES because the customer’s effort is less if their issue is resolved in first contact without the need to follow up.
According to a study cited in the Harvard Business Review, FCR reduces customer effort and actually builds customer loyalty more than any other factor.
Industry standards for satisfactory FCR are around 65-75%. FCR rates close to 90% are generally considered high, while 40% are considered low.
How to measure it?
The easiest way to calculate the first contact resolution rate is to divide the total number of resolved queries on the first contact by the total number of queries received during the given period ( this can be calculated daily, weekly, monthly, etc.).
You can use the following formula:

8. Churn Rate
Customers are the lifeline of any business, and customer churn rate is a critical customer service KPI that needs continuous attention and meticulous analysis since you need to evaluate why customers stopped using your product or service.
The churn rate tells you what portion of your customers leaves over a period of time. Companies need to understand the churn to meet the buyers’ needs. It’s often helpful to look at churn by product, region, or other granular factors, like customer service.
In fact, poor customer service is the primary cause of customer churn. According to Oracle’s Customer Experience Impact Report, the top two main reasons why customers leave the company are incompetent staff and rude staff, and unbearably slow service.

That’s not all!
As per the Zendesk Customer Experience Trends Report 2022, over 61 percent of users will stop doing business with a brand after just one bad customer service interaction. If this information isn’t enough: 76 percent will leave after multiple negative experiences.
How to measure it?
The churn rate formula is: (Lost Customers divided by Total Customers at the start of the time period) x 100.

For instance, if your business had 250 customers at the start of the month and lost 10 customers by the end of the month, divide 10 by 250.
9. Ticket Volume
The Ticket Volume metric is vital because it gives you an overall picture of your customer support team’s workload. If you want to assign the work evenly and care about your support agents, then track the ticket volume to identify patterns among increasing or decreasing tickets over time.
Any unusual growth or spike could indicate some problem going on. You may need additional agents to respond and troubleshoot the issues.
How to measure it?
Total tickets for the selected period = Ticket volume
Pro Tip: Measure your customer support performance with Juphy’s actionable reports about the number of tickets raised and pending resolution.

10. Ticket Resolution Rate
The ticket resolution rate is the percentage of the number of tickets assigned to the number of tickets resolved, by an agent, within a selected timeframe.
It is a significant indicator that shows the effectiveness of your customer service organization. It proves that you’re solving customer problems on time.
This metric tells you how promptly and efficiently your customer service team solves and closes tickets. A higher rate means fewer tickets are left unresolved. It is possible when you have sufficient representatives to handle all received queries.
Resolved tickets reflect your team’s process efficiency, performance, and information flow among the team members. When a ticket is raised, your customer support’s team goal should be to resolve the case as quickly as possible.
How to measure it?
The total number of tickets solved/closed divided by the total number of tickets x 100 = Ticket resolution rate.
Calculate the ticket resolution rate using this formula:

This gives you a percentage of the total resolution rate. The higher the ratio, the more tickets you mark as “solved,” reducing the number of tickets to be served on the ticket list. This metric can be calculated daily, weekly, or monthly.
Look for short resolution times, which means that your customers’ issues are being solved quickly — and more customers are walking away satisfied.
Pro Tip: You can use Juphy’s reporting system to see how many customer tickets were marked as “solved” or “closed” compared to the total number of tickets received in a given period.
Improve Important Customer Service Metrics with Juphy
The customer service teams wrestle with challenges such as angry customers, ticket backlogs, and pressure to meet the KPIs. All this can be eliminated with Juphy.
Trusted by more than 2,000 businesses worldwide, Juphy is an all-in-one, multichannel customer service helpdesk that is loaded with features that can transform your business into a support powerhouse and customer support into a business driver.
Social Inbox
Juphy’s social inbox, reporting & analytics, and team collaboration allow businesses to access all critical information related to KPIs. Our unified inbox helps to manage all your social conversations from one unified dashboard.
The most significant area regarding customer care KPIs is the response time. Juphy’s ‘Social Inbox’ feature makes it easier to collect and access all the incoming messages, notifications, and comments on a single dashboard, which means better engagement, faster communication, and more customer satisfaction.
Canned Response
Over 96% of customers believe that prompt customer service is essential in their choice of loyalty to a brand.
Juphy’s Canned responses can be a great way to improve customer support key performance indicators (KPIs), as they speed up the conversation by instant replies with total accuracy.
Fast response time means greater customer satisfaction scores, leading to higher customer retention and revenue.
With pre-drafted canned replies, agents can provide quick and accurate information, which makes the conversation effective and helps to close the conversation faster and effectively. It improves the key business metric, i.e., the first response time (FRT).
Reporting
Juphy’s robust reporting system offers curated reports to track critical metrics, build the customer experience, and take your business to new heights.
Our actionable reports provide business intelligence that can help you improve your company’s overall customer experience.
Ticketing
Juphy’s ticketing system helps businesses deal effectively with high customer support requests from different communication channels. You can follow the tickets, complaints, comments, and messages in the notifications from social platforms in a single tab, assign them to agents, and tag them.
Social listening, ticket filtering, and inbox classification are among Juphy’s most prominent features and allow you to customize according to your customer’s priority.
Final Words
Customer service is more about consumers, and customer service metrics and KPIs are a great indicator of what works to deliver excellent customer service. That said, figuring out what customer service metrics best serve your company and your team can be tricky.
Customer service is more about consumers, and customer service metrics and KPIs are a great indicator of what works to deliver excellent customer service. That said, figuring out what customer service metrics best serve your company and your team can be tricky.
The ten customer service KPIs listed in this blog provide a data-driven analysis of the effectiveness and satisfaction of your customer support team.
Juphy’s features serve as an excellent medium for delivering reliable customer service. Improve your customer service metrics with Juphy, and you’ll likely see customer retention and loyalty skyrocket.
Start your 7-day a free trial of feature-rich customer support software and redefine your customer service.
FAQ
Customer success metrics and KPIs are the measurable indicators that reflect your support process and the state of your customer’s happiness level. It paints a clearer picture of success for the long-term viability of a business.
Customer service metrics and KPIs help you and your team understand where you are, where you want to go, and how you’ll get there and align with your company’s goals. It helps to:
* Measure team performance.
* Boosts customer satisfaction.
* Improve customer retention.
Customer Effort Score (CES) is a single-item customer experience metric that measures the effort your customers put in to interact with your brand and how easy it is for them to do business with you.
To calculate AHT, add up the tidal time it takes to close a ticket from when your customer initially reached out, hold/wait time, back-and-forth interaction and subsequent tasks, and post-interaction system updates.
Related Article – Social Proof: Definition and Best Practices

Unlock the power of social proof to boost your brand by learning the core of the concept with examples and best practices. Read more now!
